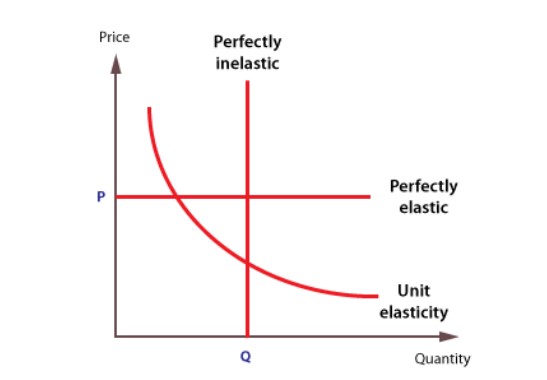
As rooftop solar PV, battery storage and ultimately, vehicle-to-x technologies, create generation alternatives and the means to store energy, artificial intelligence (AI) has the potential respond to pricing fluctuations. All this indicates none of the above characteristics of price inelasticity will remain true in the very near future.
As we move towards a future where customer agents, such as AI, can respond in real-time to electricity price signals and control more of our energy demand and supply, it is critical that these price signals are efficient. Otherwise, consumer energy resources (DERs) could be wasted or even operate to increase system costs.
For example, if all DERs respond to the same off-peak price signal, they may all start generating electricity at the same time, creating a new peak. This would be inefficient and would increase costs for everyone.
To avoid this, it is important to have electricity price signals that accurately reflect the real-time cost of generating and delivering electricity. This will help to ensure that DERs are used in the most efficient way possible.
Economic Efficiency in Energy
Economists agree on three complementary measures of economic efficiency: productive, allocative, and dynamic, that account for fluctuations and causal relationships between cost, prices, demand and technological progress. Using Gregory Mankiw, author of Principles of Economics, who defines these measures, we can overlay these principles onto an electricity system.
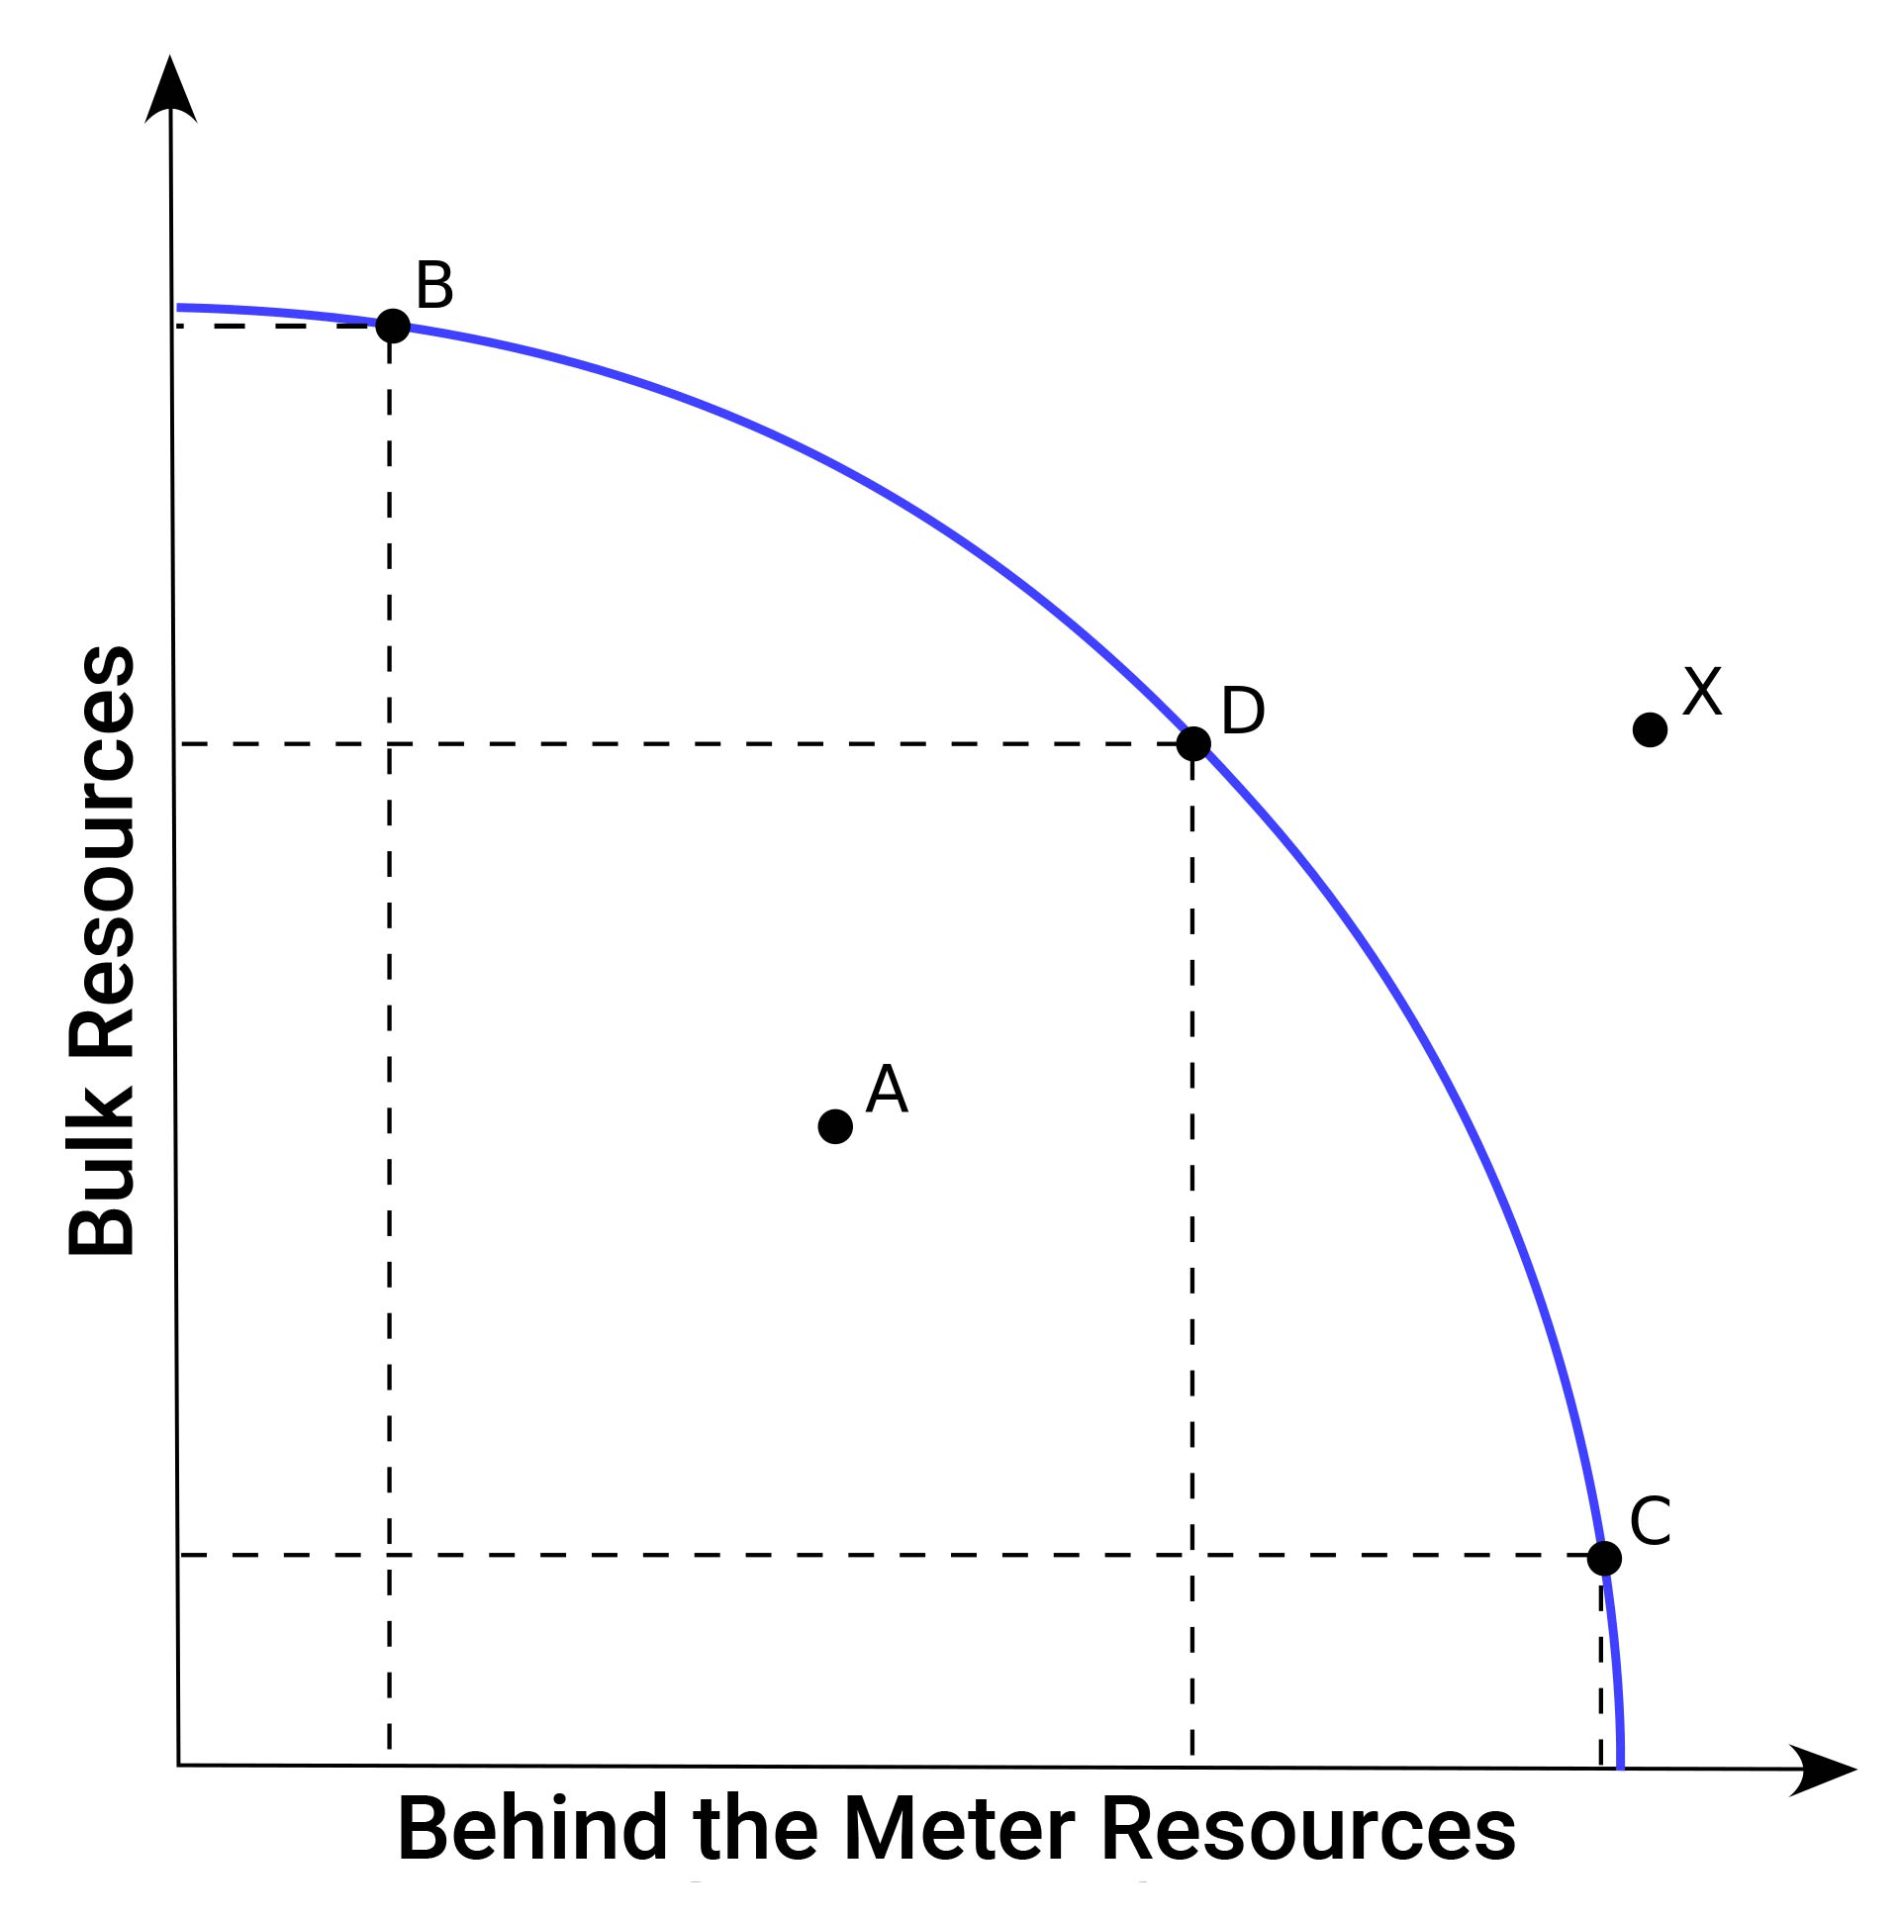
Productive efficiency is defined as the state of affairs in which the inputs used to produce a given output are minimized and thus operating on its production possibility frontier.
In terms of energy decarbonization, an example of productive efficiency can be represented in any least cost CO2 pathway to net zero emissions. In other words, that will reduce greenhouse gas emissions to a target level at the lowest possible cost.
The figure below shows a range of combinations of centralised (bulk) resources and decentralised resources, each sitting on the efficient frontier. If centralised resources are used more than the ratio described in theory below, the result will be lower system efficiency.