


The State and Outlook for Nuclear Generation
Explore the future of U.S. nuclear energy and how shifting policies, next-generation technologies like SMRs and microreactors, and global competitiveness are shaping the nuclear landscape.

The State of the Art in Virtual Power Plants (VPPs)
Explore how Virtual Power Plants (VPPs) and Home Energy Management Systems (HEMS) are transforming energy systems. Learn why they’re critical to managing rising demand, cutting
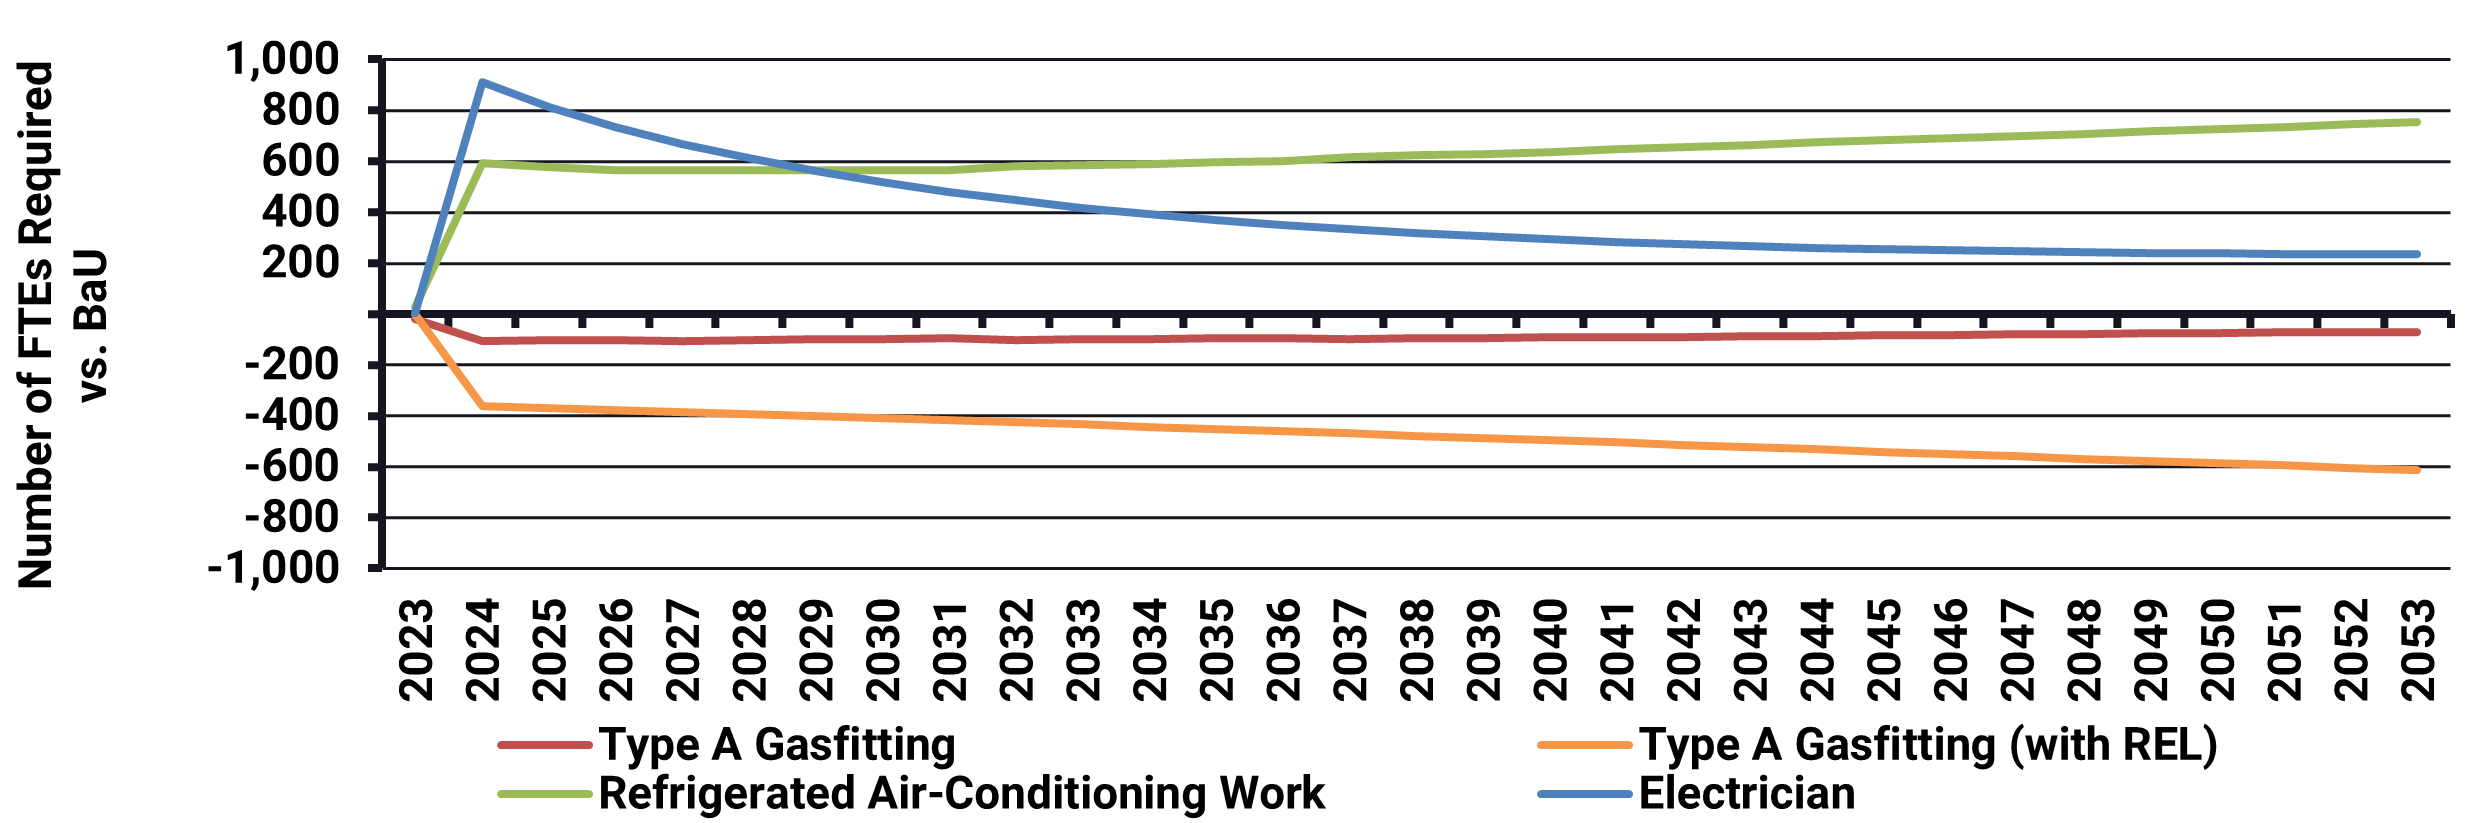
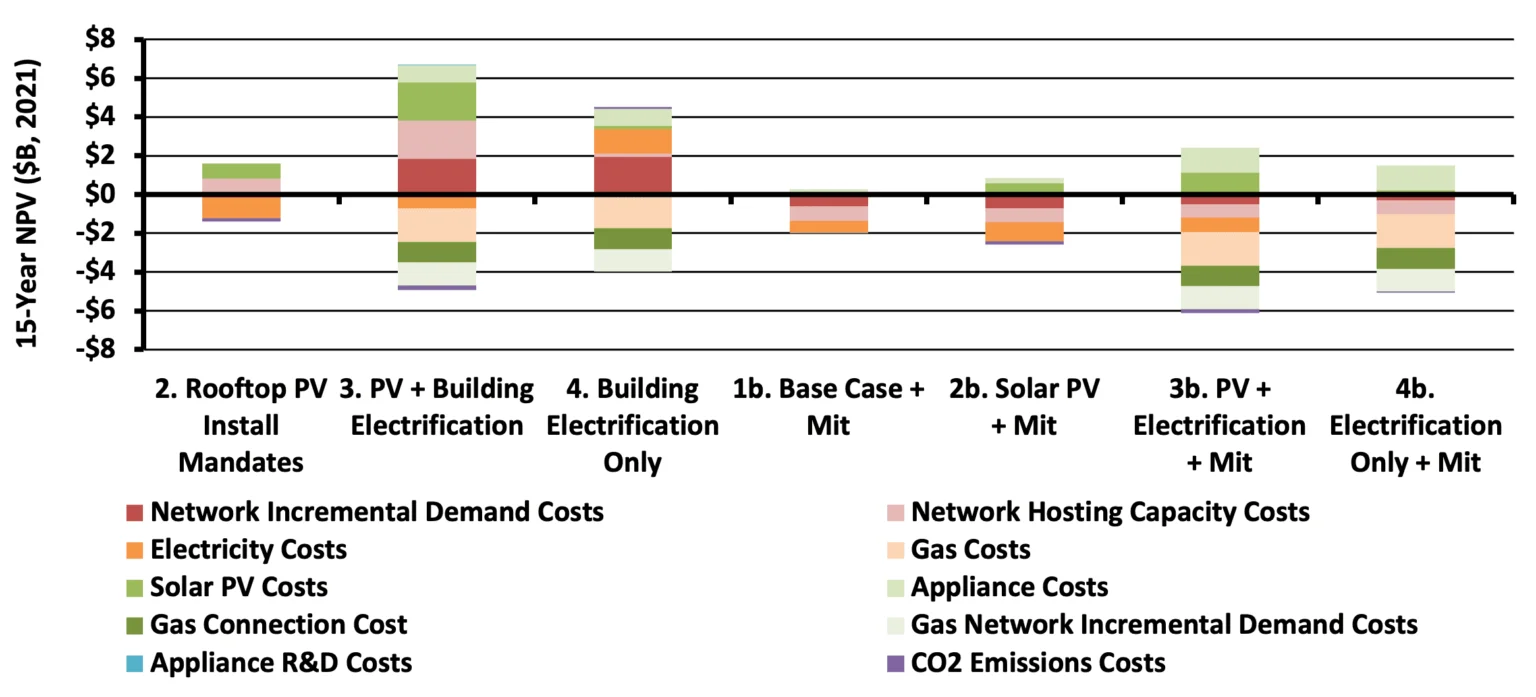
Moreno Valley Integrated Resource Plan (IRP)
Energeia was engaged by Moreno Valley Utility (MVU) to develop their 2023-25 Integrated Resource Plan (IRP). As part of this process, Energeia will be analyzing