- Webinars
Identifying a Least Cost CO2 Pathway
The US has rejoined the Paris Accord in 2021, which will result in net zero CO2 emission targets by 2050. Under the Paris Accord, countries commit to reviewing their targets every five years, increasing them where they can be done at the same or lower cost. Implementing a CO2 Pathways model that enables least cost pathway identification and regular updates is therefore essential.
The following sections detail the current targets at the Federal and selected state levels and provide an overview of best practice CO2 Pathway optimization for achieving sustainable CO2 reductions.
CO2 Targets for the US and Leaving States
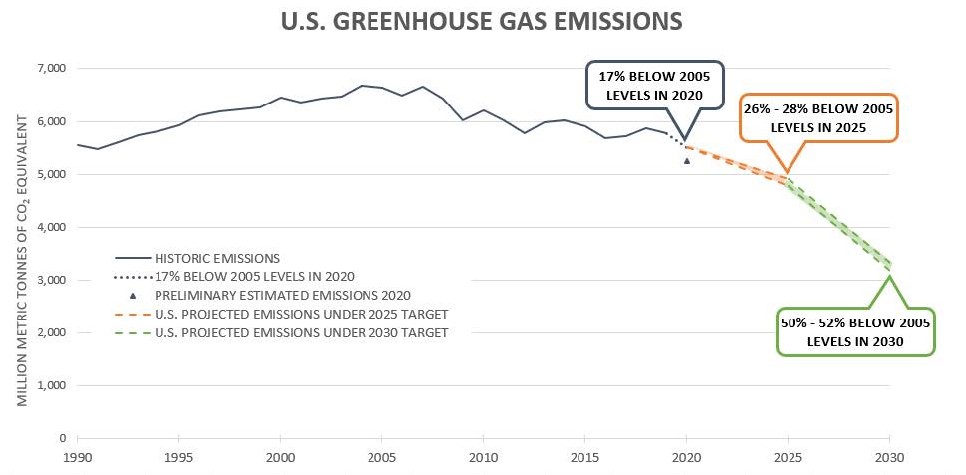
To achieve this goal, the US targets a 50-52% reduction in 2005-level (baseline) emissions by 2030 and net-zero by 2050. The United States’ Nationally Determined Contribution (NDC) highlights key roles for renewable energy, efficiency improvements, transport electrification, carbon capture, and methane emissions reductions. However, no detail is given regarding their cost or impact.
Approximately US $275 trillion is projected to be incurred by the US in spending on physical assets to achieve its 2050 net-zero goal.
State-level CO2 targets vary substantially in terms of baseline year and trajectory, with California, Colorado, Oregon, Massachusetts, and Maryland undertaking some of the most comprehensive climate action plans driven by state policy. States with the most comprehensive CO2 roadmaps are included below, but they may not represent the states with the most stringent targets.
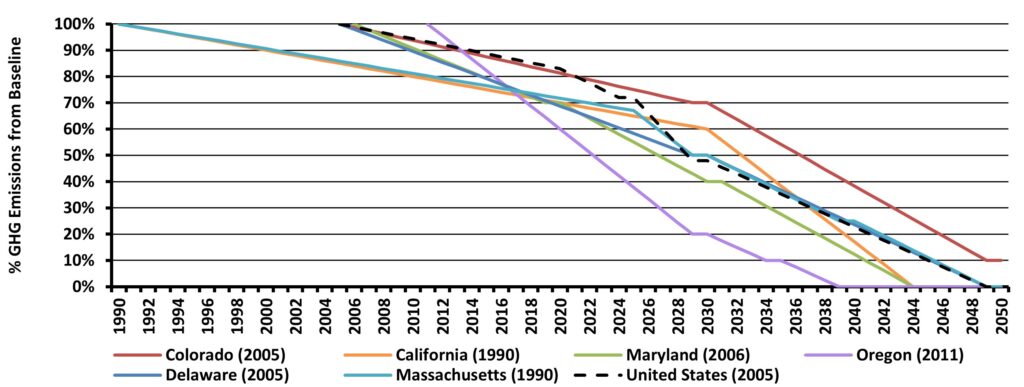
The figure above shows Oregon to have the most stringent zero CO2 target in 2040, with California and Maryland following in 2045. Massachusetts is aligned with the Paris Accord timing of the US, and Colorado is planning sometime after 2050.
The relative size of the challenge of these targets and where the CO2 reduction will need to come from is shown in Figure 2 on a per capita basis. This view shows that most states, other than Delaware and Colorado, have a comparable amount of C02 per capita, mostly concentrated in transport.
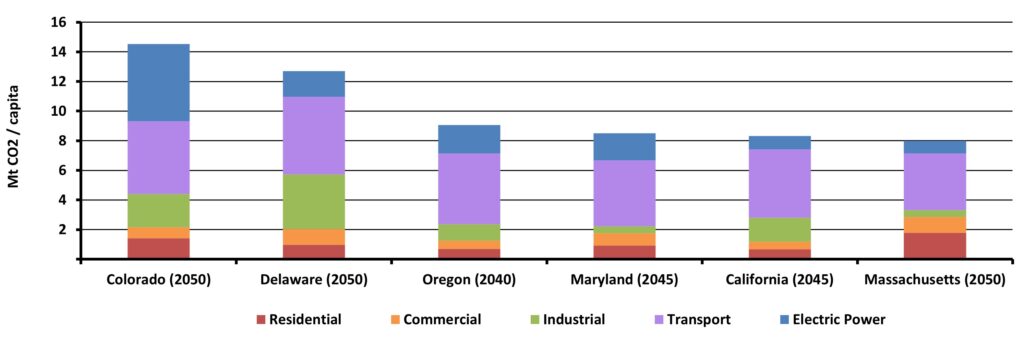
All things being equal, the states with the same target timing but higher per capita emissions, such as Colorado and Delaware, have a relatively greater challenge than those with the same target, like Massachusetts, and around a third less emissions to address.
Across all states, the question is which CO2 pathway is least cost?
Listen or click through at your own pace
Case Study: State of Colorado
As shown below, Colorado translated international warming scenarios into emissions targets under its Climate Action Plan to Reduce Pollution, also known as House Bill 19-1261. The act targets mainly reducing 2025 greenhouse gas emissions by at least 26%, 2030 emissions by 50%, and 2050 emissions by at least 90% of the levels that existed in 2005 (baseline).
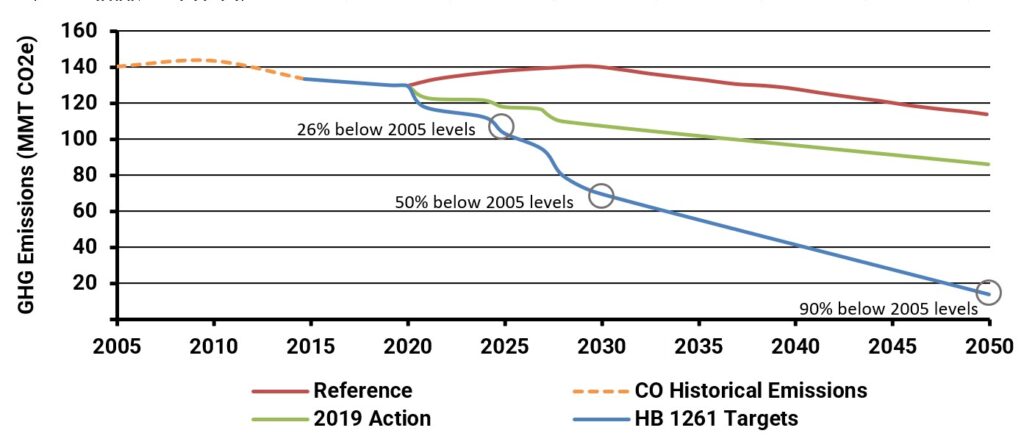
Colorado’s historical emissions by sector are shown below.
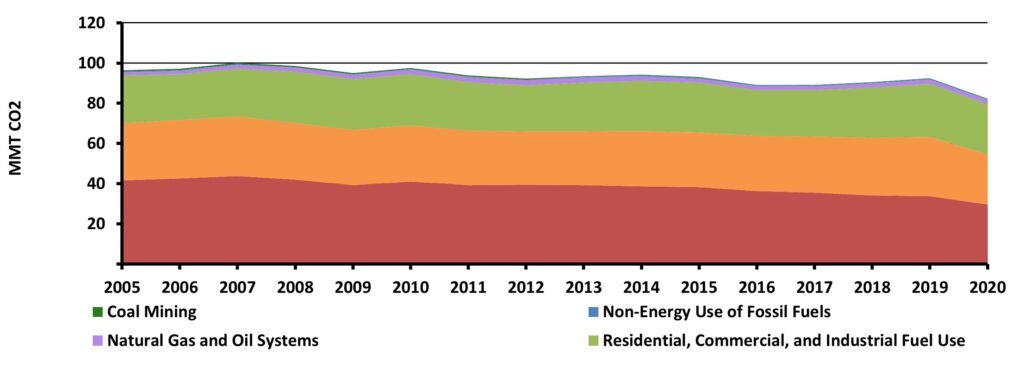
Determining the most appropriate CO2 reduction pathway for Colorado across gas and electric utilities, CO2-intensive industries, transport, and buildings requires balancing off the associated costs and benefits, which in turn requires significant, detailed knowledge about:
- Industry sectors
- End uses
- CO2 reduction technologies
- Supply costs
- Customer behavior
To date, developing this level of detailed modeling was a Herculean effort undertaken by only the largest jurisdictions and only infrequently. Technology has evolved, and it is now possible to achieve this level of insight with much greater frequency at a much lower cost.
CO2 Pathways Models
Due to the significance of global CO2 reductions, substantial effort and investment have gone into developing CO2 emissions models, often called CO2 ‘Pathways’ models. These are used to model the impacts, costs, and benefits of alternative CO2 pathways. Forecasting on a scenario basis allows the identification of the least cost pathways.
Energeia’s review of CO2 pathways modeling and development of least cost pathway implementations found that best practices include the following:
- Development of accurate estimates of measure costs over time as a key input
- Coverage of all key sectors, segments, end uses, existing stock, and customer segments
- Use of stock and turnover methods to identify emissions over time
- Use of a linear solver to identify a least cost pathway given cost and stock estimates
- Customer behavior modeling to identify uptake of measures and the role of incentives
- Reporting of measure volumes, measure costs, and energy costs
- Reporting of 8760 electricity, natural gas, and CO2 impacts
- Reporting on a spatial basis, e.g., regional or more granular
An example of an illuminating CO2 pathway model output is a supply cost curve shown in Figure 4. In Energeia’s experience, while modeling CO2 pathways for a leading jurisdiction in the US, developing a CO2 emissions supply cost curve by year and over time was the key to identifying an optimal pathway. The CO2 pathway model was essential in identifying the prioritization of emissions in their pathway to achieving a given target at the least cost.
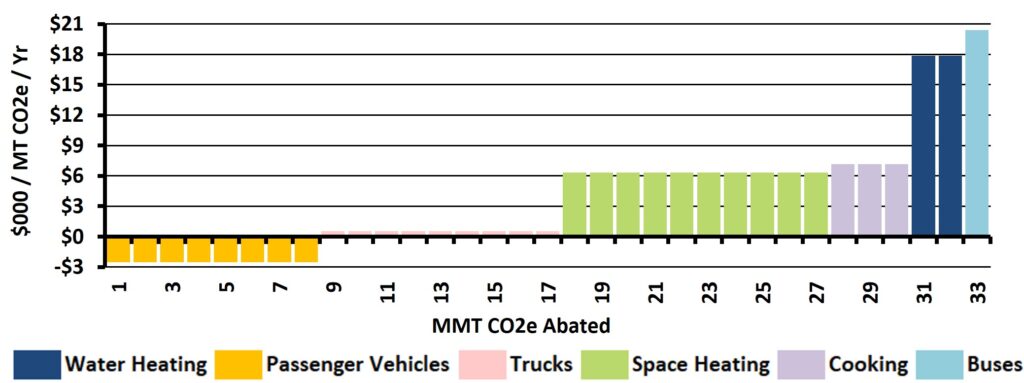
A supply cost curve can also feed back into target setting by identifying changes in cost over time and the additional level of abatement that can be delivered for the same cost, as the Paris Accord requires. Another key use is to identify measures expected to deliver the greatest benefit or the end use that is the highest cost to decarbonize, both of which can be used to target and optimize research and development investment.
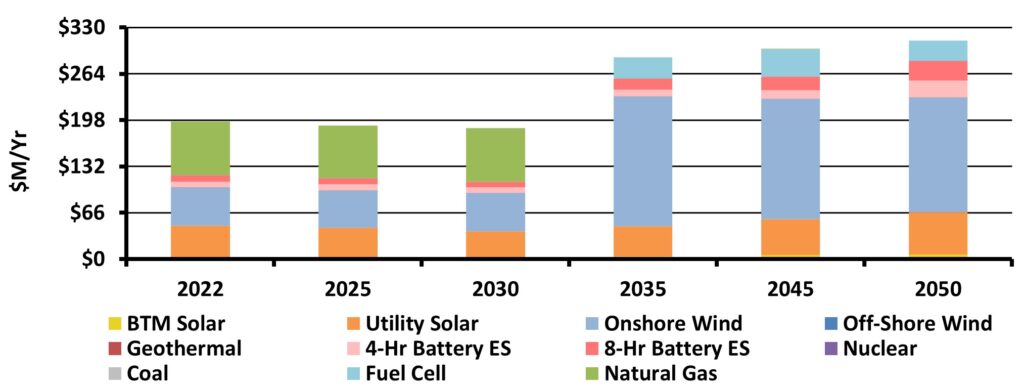
A final step in the CO2 pathways modeling and optimization process, where most reduction efforts are moved to the electricity system, is identifying the least cost mix of resources needed to deliver the target CO2 levels over time. The figure below shows the results of a recent CO2 pathways and optimization modeling project, which found that onshore wind and fuel cells were the keys to achieving a net zero carbon and, eventually, a 24/7 electricity system by 2035.
For more detailed information regarding the key challenges of analyzing and optimizing CO2 pathways, best practice methods, and insight into their implementation and implications, please see Energeia’s webinar and associated materials.
For more information or to discuss your specific needs regarding CO2 pathways modeling, please request a meeting with someone from our team.
You may also like

Moreno Valley Integrated Resource Plan (IRP)
Energeia was engaged by Moreno Valley Utility (MVU) to develop their 2023-25 Integrated Resource Plan (IRP). As part of this process, Energeia will be analyzing
BESS Forecasting for an Array of Cities Nationwide
Energeia’s research and data engineering expertise proved essential in building a comprehensive custom database of utility grid infrastructure spatial data for each target market.

LADWP Develops an Integrated Human Resources Plan to Aid the LA100 Program
Los Angeles Department of Water and Power (LADWP) gathered a team of leading industry experts, including Energeia, to develop an Integrated Human Resources Plan (IHRP)

